Wheat market 2022
Wheat market briefings - Economic update 10 August 2022
- The Russian invasion of Ukraine led to a significant rise in the global grain prices in February / March 2022. The market has since eased back as harvest begins in the Northern hemisphere and there are hopes of grain beginning to move from Ukraine’s Black Sea ports. Nevertheless, wheat prices remain volatile and well above the equivalent level a year ago, with strong premiums for protein whether in the grain or as added gluten. There is some speculation that the EU maize crop will be reduced by the drought, which will result in firmer grain prices. Other input costs, especially energy, remain very high. Both electricity and gas markets are extremely nervous ahead of the winter in face of the threat of Russian refusal to supply gas to Europe. This note and supporting charts provide an overview of the key factors.
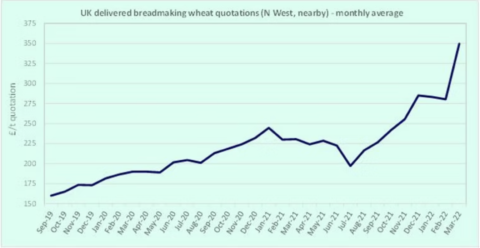
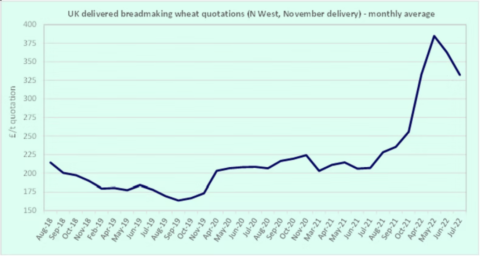
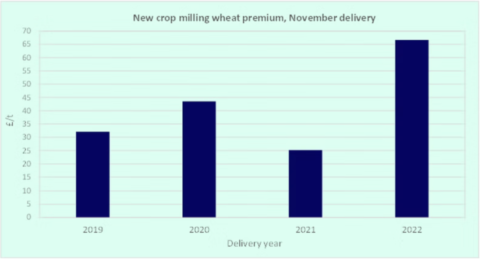
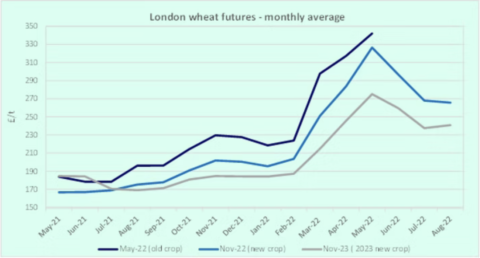
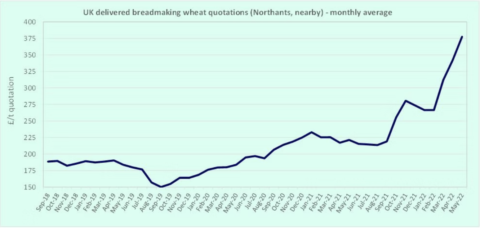
- Although below their peak, grain prices remain very high. The benchmark November delivered price quotation for bread wheat in NW England is £328.50; a year ago it stood at £206.00, an increase of 60% year on year (Figure 1). The milling premium over futures has also opened to over £65 per tonne, compared with £25 a year ago (Figure 2).
- Whilst the war in Ukraine has had a significant price impact as it has disrupted supply and boosted demand in some importing countries as they look to secure food for their people, weather uncertainties have also played a part along with political interventions, such as India’s decision to suspend exports. The premium for higher protein bread wheats over feed (noted above) is a result of lower protein crops in key origins. This has also led to the cost of wheat gluten, which can be added to lower protein wheats in some grists, more than doubling year on year. Alongside quality concerns, the high premium in the UK also reflects the rising cost of haulage.
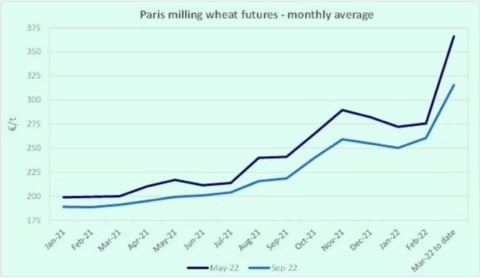
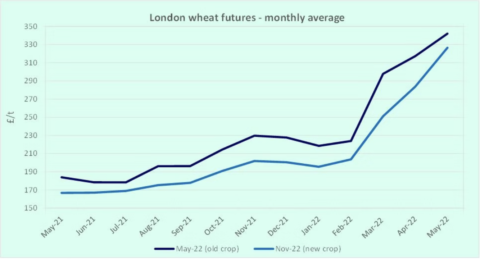
- Some may have expected the war in Ukraine to cause a short-term impact on wheat prices, however, disruption to Black Sea wheat exports is likely to last for a lengthy period. Although there have been reports of Ukrainian grain leaving via the Black Sea, these have been small in number and appear to be the vessels that have been stuck in ports since February. Coupled with strong global demand, weather concerns and high fertiliser costs, longer-term price pressure is expected and 2023 futures quotations offer only slight relief (Figure 3).
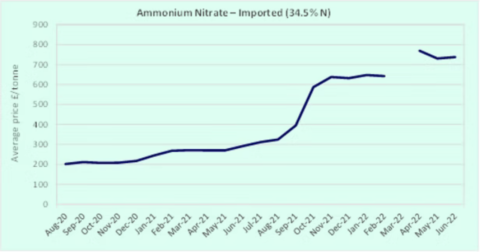
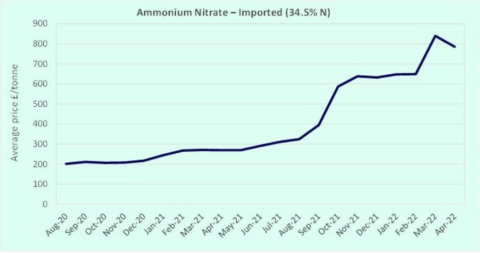
- High nitrogen fertiliser costs, which are closely linked to gas prices, may lead to reduced applications by growers in 2022/23. This is a global trend and raises concerns about both the likely yield of grain in 2023 and the future availability of protein crops – again supporting forward grain prices.
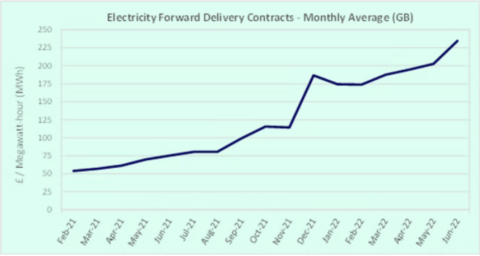
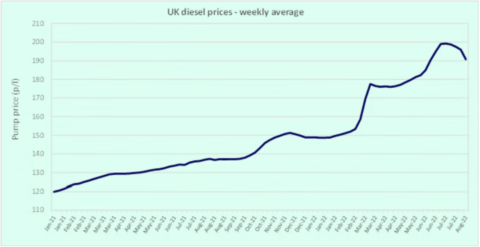
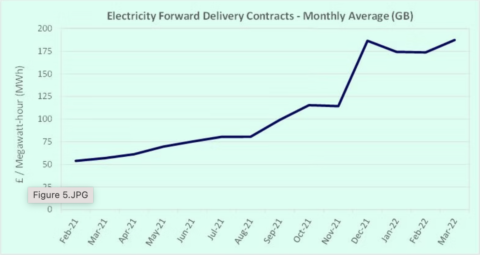
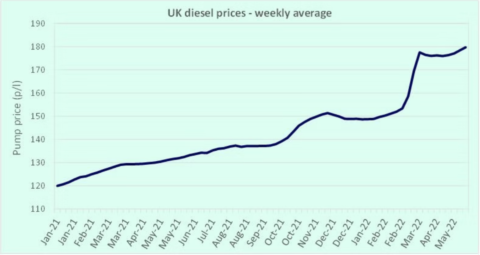
- In addition to wheat, the price of fertiliser (Figure 4), energy (Figure 5) and fuel (Figure 6) remain high and continue to apply significant cost pressure across the food chain. There are also concerns haulage availability will be tight at harvest, as in 2021, particularly when the sugar beet campaign begins. Gas and electricity pricing and availability is also volatile depending on fears of Russia cutting supplies of gas to the EU.
- The new crop price quotations, high fertiliser prices and energy costs highlight that food price inflation is unlikely to be a transient spike owing to the war in Ukraine, but will be a prolonged issue over the coming months. This was well analysed by the Institute for Grocery Distribution in a recent report, which is publicly available at the following link.
Economic update 24 May 2022
Whilst the Russian invasion of Ukraine led to a significant rise in the global grain prices, other factors have continued to push quotations for both old crop and new crop grain to record or near-record highs. This note and supporting charts provide an overview of the factors.
Grain prices are now at record highs, with delivered quotations for breadmaking wheat in all parts of the UK approximately 70% higher than at the previous harvest (September 2021). Figure 1 shows the trend for Northamptonshire; values are even higher in parts of the country further from the main UK wheat supply regions.
- Whilst the war in Ukraine has had a significant price impact, weather concerns in key production regions, in particular drought in the US, have tightened global supply and demand and pushed quotations even higher. The recent announcement by India of a partial wheat export ban has added further price support.
- Some may have expected the war in Ukraine to cause a short-term impact on wheat prices, however, disruption to Black Sea wheat exports is likely to last for a lengthy period. Coupled with the weather concerns for the 2022 wheat harvest and strong global demand, longer-term price pressure is expected and new crop quotations will not provide relief, standing close to old crop with both at record highs. (Figure 2)
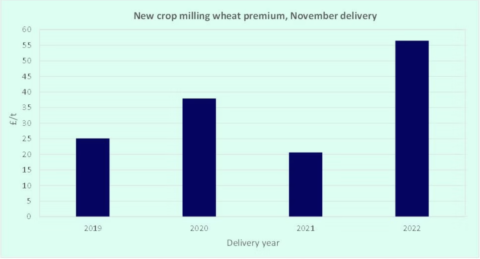
- Although a sizeable UK wheat harvest is anticipated, high nitrogen fertiliser prices may lead to reduced applications by growers, which could have a significant impact on UK milling wheat where greater nitrogen applications are needed to achieve the standard breadmaking protein specification of 13.0%. The new crop premium of delivered breadmaking wheat (Northamptonshire) over feed futures reflects these concerns, standing at approximately £56/t, over double the equivalent premium in 2021. (Figure 3)
- In addition to wheat, the price of fertiliser (Figure 4), energy (Figure 5) and fuel (Figure 6) remain high and continue to apply significant cost pressure across the food chain. There are also concerns haulage availability will be tight at harvest, as in 2021, particularly when the sugar beet campaign begins.
- The new crop price quotations, high fertiliser prices and energy costs highlight that food price inflation is unlikely to be a transient spike owing to the war in Ukraine, but will be a prolonged issue driven by weather concerns in key wheat-producing regions coupled with sanctions on Russian trade.
Impact of conflict in Ukraine - Economic update 15 March 2022
This note and supporting charts provides a brief summary of the impact on markets relevant to flour milling and many other parts of the supply chain for grain-based foods.
Pricing
The past weeks leading up to and since the Russian invasion of Ukraine have been tumultuous for grain markets around the world and in the UK. This affects flour millers and other grain users such as animal feed manufacturers.
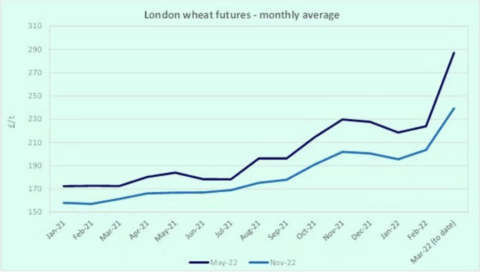
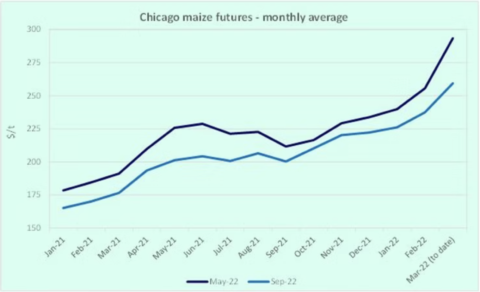
- Wheat prices now stand some 60% higher than they were at the time of the last harvest, in September 2021 (Figures 1.1, 1.2 and 1.3). There is a similar scale of increase in the cost of maize (Figure 1.4) and other ingredients used for animal feed.
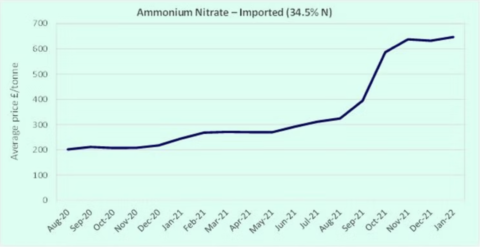
- Fertiliser prices are four times higher than they were a year ago, which will affect the cost of production for future crops and will encourage some farmers to reduce usage and therefore future yield (Figure 2).
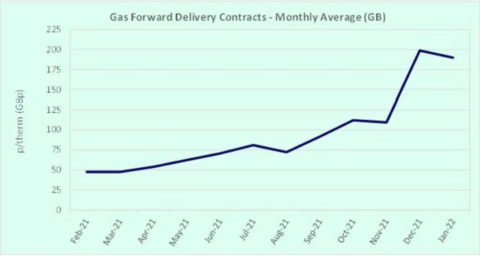
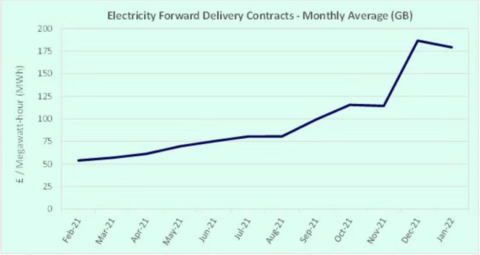
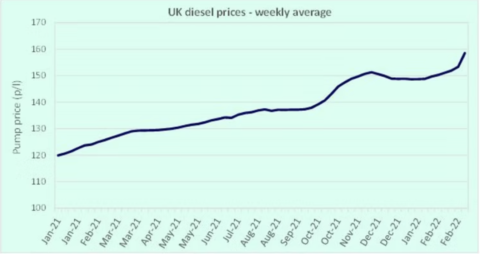
- Energy prices – both oil and gas – have also been driven very much higher, as is obvious to anyone driving. Gas and electricity prices for business are not capped as they are for consumers, meaning that the food chain is already exposed to these increases (Figures 3.1, 3.2 and 3.3).
- 25% of flour is delivered in paper packaging. Costs of paper pulp rose by 50% in the period January 2020 to December 2021 ahead of the conflict. They are likely to be further affected because a proportion of supply normally comes from Russia and is now subject to embargo.
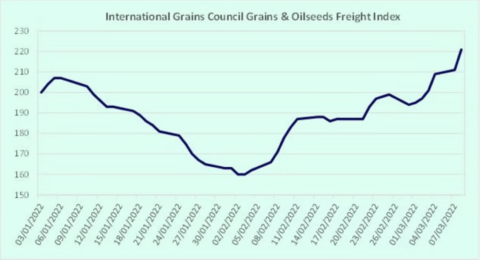
- The cost of freight, having been in decline since the start of the year as coronavirus restrictions eased, has risen by 35% since the beginning of February (Figure 4). Quite a few vessels are effectively trapped in the Black Sea area.
The charts below illustrate the changes in recent months. Although businesses throughout the chain will do all they can to mitigate the impact, these developments will inevitably lead to higher prices for a whole range of products, and the anticipated spike in food price inflation will be higher and last for longer than had been anticipated at the start of 2022.
Supply
The direct impact on UK availability (as distinct from cost) has been limited to specific sectors such as sunflower seed, some organic grain supply chains and to a small extent grain for animal feed. Flour millers source wheat mainly from the UK (85%), Germany and Canada, with only very minor quantities coming from Russia or Ukraine. Therefore, there is no immediate threat to the availability of flour or products with flour as a major ingredient. Nevertheless, with markets very volatile and the reaction of governments unpredictable, careful monitoring of the supply and demand situation is required prior to the next harvest in the summer.
The next grain harvest in the Northern hemisphere is due in June-October 2022. Some spring crops have yet to be planted which means that growers in some parts of Europe, the northern USA and Canada have an opportunity to increase their planted area in response to higher prices. This would help to offset any shortfall in supply next autumn from Ukraine and Russia.
You can download a copy of this briefing note here.